In recent years, selling on Amazon has become much more of a science than an art form. Far more often than not, there is a definitive, data-driven explanation of why your sales are rising or dropping. Enter advanced Amazon seller analytics.
It’s easy for Amazon sellers to spot fluctuations in sales. Profits are either up or down — you don’t need an advanced data analytics degree to view your bottom line. But digging into the Amazon Seller Central data and identifying root causes is a different beast.
There are dozens of reasons that could explain why a product is succeeding or failing. Is your listing optimized with the right keywords? Is your product earning positive reviews? Is it priced appropriately? Is it the right season? Is your business even tracking the right KPIs and metrics?
We could go on and on with these questions, but you get the point — without Amazon seller analytics data tracking your Amazon profits and losses over time, you’re making key strategic decisions in the dark. Effective Amazon sellers need effective data analytics software to maximize profits.
We’re very excited to announce that FeedbackWhiz is now offering its new Profits feature which enables Amazon sellers to customize their data to identify trends and strengthen their businesses.
Here are 5 essential Amazon seller analytics capabilities that your eCommerce store should utilize.
5 Essential Amazon Seller Analytics For Your eCommerce Store
1) Customizable Amazon Sales Tracking Categories For Deeper Insights
![]()
Amazon Seller Central allows sellers to sort their products by ASIN and export data to Excel. But as a busy person running a business and a million things to get done, you probably don’t have time to build complex data analytics tables in Excel — let alone the additional hours combing through hundreds or thousands of rows and columns.
In order to optimize your data to produce clear, bottom-line-driven solutions, you want to customize into the categories well beyond ASIN and SKU. You need to be able to organize your business dashboard data into the categories that are most important to you.
With specialized Amazon seller analytics software, you can sort your inventory however you like. Some of the most useful custom sorting categories are:
• Product
• Product category
• Order volume
• Sales volume
• Gross sales
• Net profit
• Unit price
• Units sold
• Specific date ranges
• International Amazon marketplaces
By manipulating categories to gain new insights, sellers can take their Amazon businesses to new levels. Consider a seller who offers a wide range of electronic products and clothing items. The business has been booming in recent months which has necessitated the need for more inventory and faster turnaround times.
While the growth is great, it has cut into the seller’s precious time for product research and seller strategy, leaving the seller vulnerable to inefficiencies and shrinking margins. Customizing store sales data can help this seller quantify results that otherwise would’ve required guessing and other inexact measures.
Easily sorting tech products by units sold can give you insights into the products for which you should consider raising prices. Identifying clothing items that aren’t selling can signal it’s time to investigate alternative brands or offer a promotion.
With customized categorizing capabilities at sellers’ fingertips, they can make the right strategic decisions without blindly guessing or spending hours struggling with spreadsheets.
3) Amazon International Marketplace Profit Comparisons
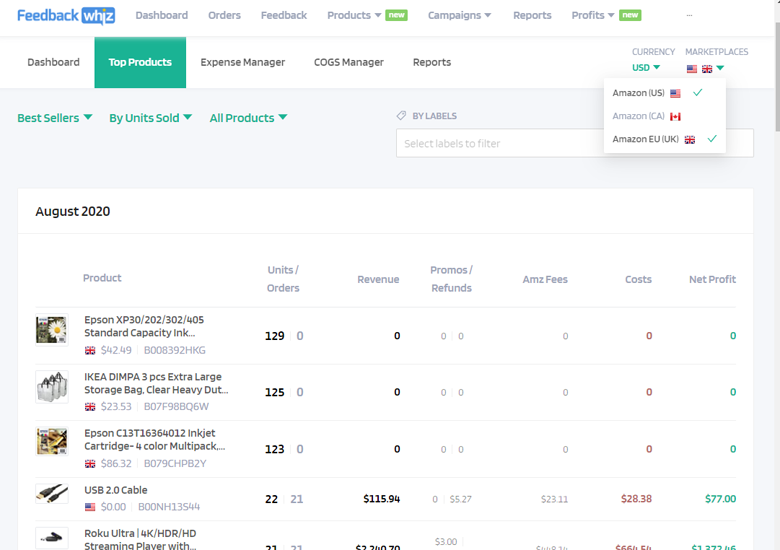
Selling on Amazon is no longer just a domestic operation. With 14 international Amazon marketplaces around the globe and rapid expansion to more emerging markets in Amazon’s sights, there are profits to be made by offering your products for sale abroad.
Amazon offers a unified account configuration to streamline your product listings across marketplaces in North America and Europe (including the United States, Canada, United Kingdom, Spain, France, Italy, Germany, and the Netherlands).
While it may be easier to get your products listed across international marketplaces than a few years ago, entering new international marketplaces presents an array of dilemmas for you to consider — ranging from international shipping fees to language barriers to different styles and consumer trends in foreign markets.
This is where robust data analytics software comes in. Comparing the success of your products across international marketplaces is critical for understanding trends and establishing yourself as a player overseas.
Consumer trends vary drastically from country to country. It’s impossible to keep up with the latest hot products in multiple countries. Without real-time international comparison tools, it’s easy to become reactionary — guessing based on hunches or inexact reference points.
Think about how helpful this information would be. With a few clicks, you can generate a chart that shows trends that you never would’ve guessed.
Suppose it’s February and women’s bathing suits are selling rapidly in the U.S. with tons of sales to California, Texas, and Florida. Shockingly, despite rainy dreary February weather, in the U.K. sales are trending upward as well.
Perhaps even more peculiarly, sales are down in Spain and Italy. No reasonable hypothesis would ever suppose that women in the UK like to buy swimsuits in February, but your data speaks the truth and you’re ready to capitalize.
Another core element of international data analytics is currency conversion capabilities. When selling products on Amazon UK, you will be paid in pounds sterling (GBP). If you live in the U.S., earning £20 doesn’t mean much to you contextually.
Is £20 equivalent to $15 or $30? Currency exchange rates fluctuate constantly. Trying to keep track of multiple foreign currencies will surely make your head spin. You need an analytics tool that can convert multiple currencies into one uniform currency (likely your home country’s currency) so you can put your calculator away and compare apples to apples.
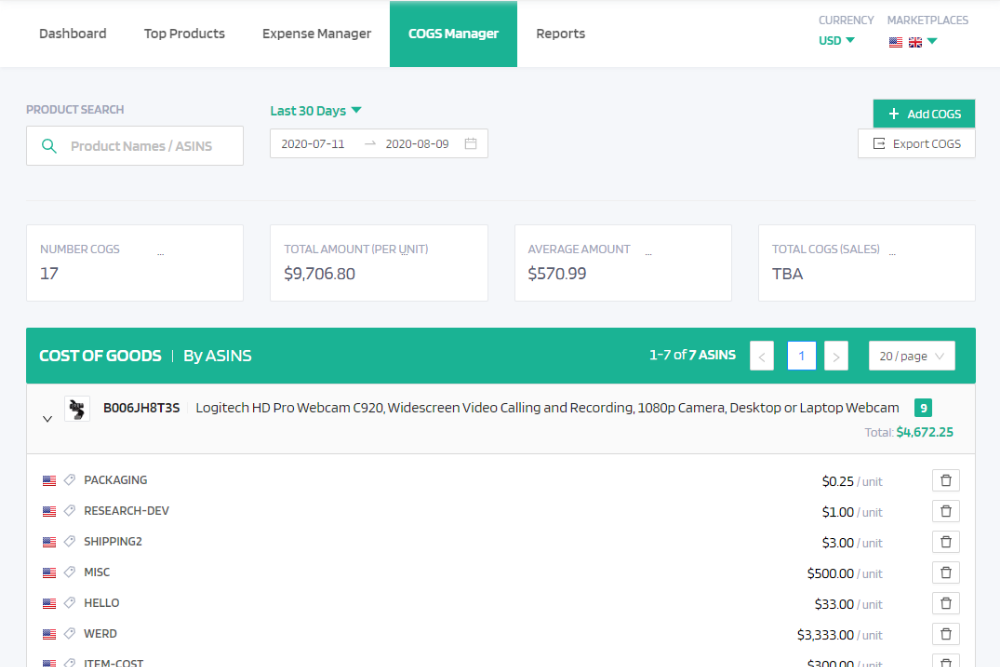
3) Customizable Expense and Cost of Goods Sold Management
As an Amazon seller, you have expenses that you anticipate and others that arise unexpectedly. Alas, they all contribute to the same end — going against your bottom line.
Some expenses fit neatly and tidily onto an accounting balance sheet — while others may be one-off expenses that seem to fit anywhere. You want accounting software that is consistent enough to handle monthly expenses that are static but flexible enough to adapt to changing conditions.
For example, suppose you purchase $2,500 worth of advertising every month — never $2,400 or $2,600. This is a fixed cost every month that should be displayed on your balance sheet. Approximately twice per year, you hire a professional photographer to take pictures of your products. The cost depends on the number of photographs and the total amount of time it takes. You need to be able to add a custom “Photography” expense to your balance sheet.
You want a software that allows you to add your own custom expense categories — not conventional cookie-cutter categories from a dropdown menu.
Similarly, the cost of goods sold (COGS) tends to fluctuate depending on a number of variables. Shipping rates, bulk discounts, packaging costs, and other fees contribute to the overall COGS. You need a software package that enables easy input of custom categories displayed at the per-unit price. A separate COGS management will help you identify how all the little expenses add up to impact your bottom line.
4) A Detailed Breakdown of Amazon FBA Fees
As most Amazon sellers know all too well, FBA sellers face a lot of little fees. They add up and slice into your profit margins much faster than you expect.
It’s easy to budget for FBA, referral, and shipping fees, but you have to consider all the fees you incur. Seemingly small or large, at the scale they all factor into your final margin. Some of the small fees that are easy to forget are:
• High volume listing fee
• Sales tax collection fee
• Variable closing fee
• Bubblewrap fee
• Inventory disposal fee
• Fulfillment fee
• Opaque bagging fee
• Taping fee
Yes, you read that correctly. FBA may charge you opaque bagging and taping fees. While these may run you less than $1 per sale, they add up when you’re selling hundreds or thousands of products each month.
Many sellers tend to lump all these fine print fees together and approach them as “water under the bridge.” It’s totally understandable if sellers don’t want to spend time and energy tackling these fees. When they’re listed in fine print at the bottom of payment receipts and you have no means to tabulate them cumulatively, how would you even begin to sift through all of them?
When separated into individual expense categories, you can streamline your processes, identify opportunities to minimize fees, and increase profit margins. To properly categorize fees, you need accounting software that allows you to build custom fee categories and aggregate data.
Lastly, you don’t want to spend precious time meticulously scrolling through every individual data point. It’s important that your bookkeeping software can automate visual charts and graphs that analyze fees over time and capture the whole story.
5) Amazon Seller Analytics Reporting: Auto-Generated Graphs and Charts
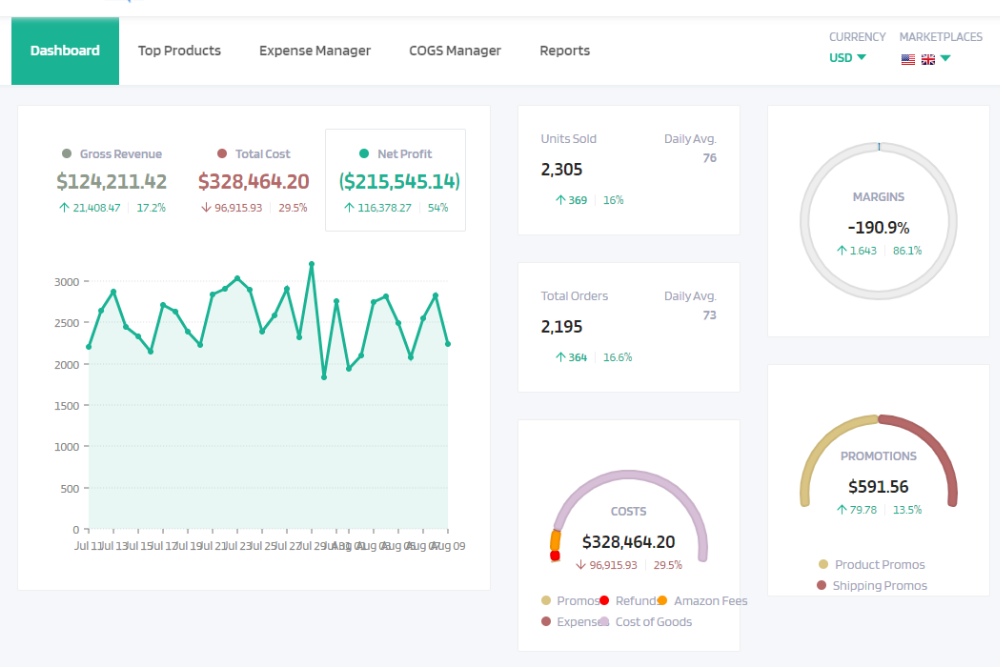
Even when you have all the important data at your fingertips, it’s easy to miss the most important takeaways if they aren’t displayed in a clear visual way.
The old adage says that a picture tells a thousand words. When it comes to digesting Amazon seller data, the saying couldn’t be more true. Bar graphs, line graphs, pie charts, and color-coding makes getting the big picture much easier.
Viewing month-over-month and year-over-year comparisons of the following six key metrics will help you see what’s working, what isn’t, and the changes that you need to make:
• Units sold
• Orders
• Net profit
• Margins
• Gross revenue
• Costs
When complex tables and spreadsheets don’t tell the whole story, clear, concise graphs usually illuminate the most important takeaways for you and your Amazon business.
Ready to try an Amazon seller analytics software that does all of the above?
Try FeedbackWhiz’s brand new “Profits” tool today to access all of the above features and take your Amazon business to the next level.
0 Comments