One of the most common metrics that gets tossed around when discussing an Amazon business is total sales. People often reference total sales as an indication of how big or small their business is. But while total sales is a useful metric, and Average Unit Retail makes a whole lot of sense, what truly matters at the end of the day is profit. FeedbackWhiz’s Profits and Accounting Tool is built to help you optimize every facet of your business to generate profit.
Calculating net profit can be a difficult and messy process without the right tools. To truly understand the health of your business, you must be able to analyze all of the data as one complete picture, factoring in every cost and profit going out and coming in. The Profits and Accounting Tracking Tool let’s you do this on both a micro and macro level with graphs and charts that cover everything from a single ASIN to overviews of your entire business.
In this article, we’ll break it all down for you and what it means for your Amazon business. Get started by checking out this short video:
FeedbackWhiz Profits and Accounting Tool Features at a Glance
In this article, we’ll give you an in-depth look at the FeedbackWhiz Profits and Accounting Tool so that you can see exactly how it works and how you will be able to utilize it for your Amazon business. This tool allows you to do all of the following:
• Track Amazon profits and losses on all of your Amazon product listings.
• Easily identify which aspects of your business are profitable and which ones need improvement with just a few clicks.
• Measure the performance of all of your Amazon product listings quickly, easily, and intuitively.
• Break down sales, taxes, promotions, refunds, seller fees and more.
• Categorize profits and losses into convenient groups to help you process the data.
• Optimize your Amazon bookkeeping system with profitability measures based on the data points most important to your business.
• View key seller metrics with beautiful graphs, charts, and interfaces.
• Access easy-to-understand visual depictions of important metrics such as gross revenue, net revenue, and net profit margins with FeedbackWhiz’s Financial Data Visualization tool.
• Customize your Amazon revenue and expense tracking system to your exact preferences.
• Include all costs of inventory management including those that the Amazon financial management system leaves out, giving you a more complete picture of your business.
• Organize all of your miscellaneous expenses into the customizable categories, i.e. listing a professional photographer under “Product Photography Expenses”.
• Compare sales metrics and analyze sales data across all of Amazon international marketplaces (U.S., Canada, Mexico, Brazil, U.K. Germany, Italy, Spain, France, China, Japan, Australia, and India).
Be sure to check out this article on the top 6 reasons to use an Amazon Profits and Accounting tool.
An In-Depth Breakdown of the FeedbackWhiz Profits and Accounting Tool
No matter where you are on the Profits and Accounting Tool page, you can use a drop-down menu in the top-right corner to choose what currency you would like to view your data in and which marketplaces you want included (if you are selling in international marketplaces as well as the United States).
Dashboard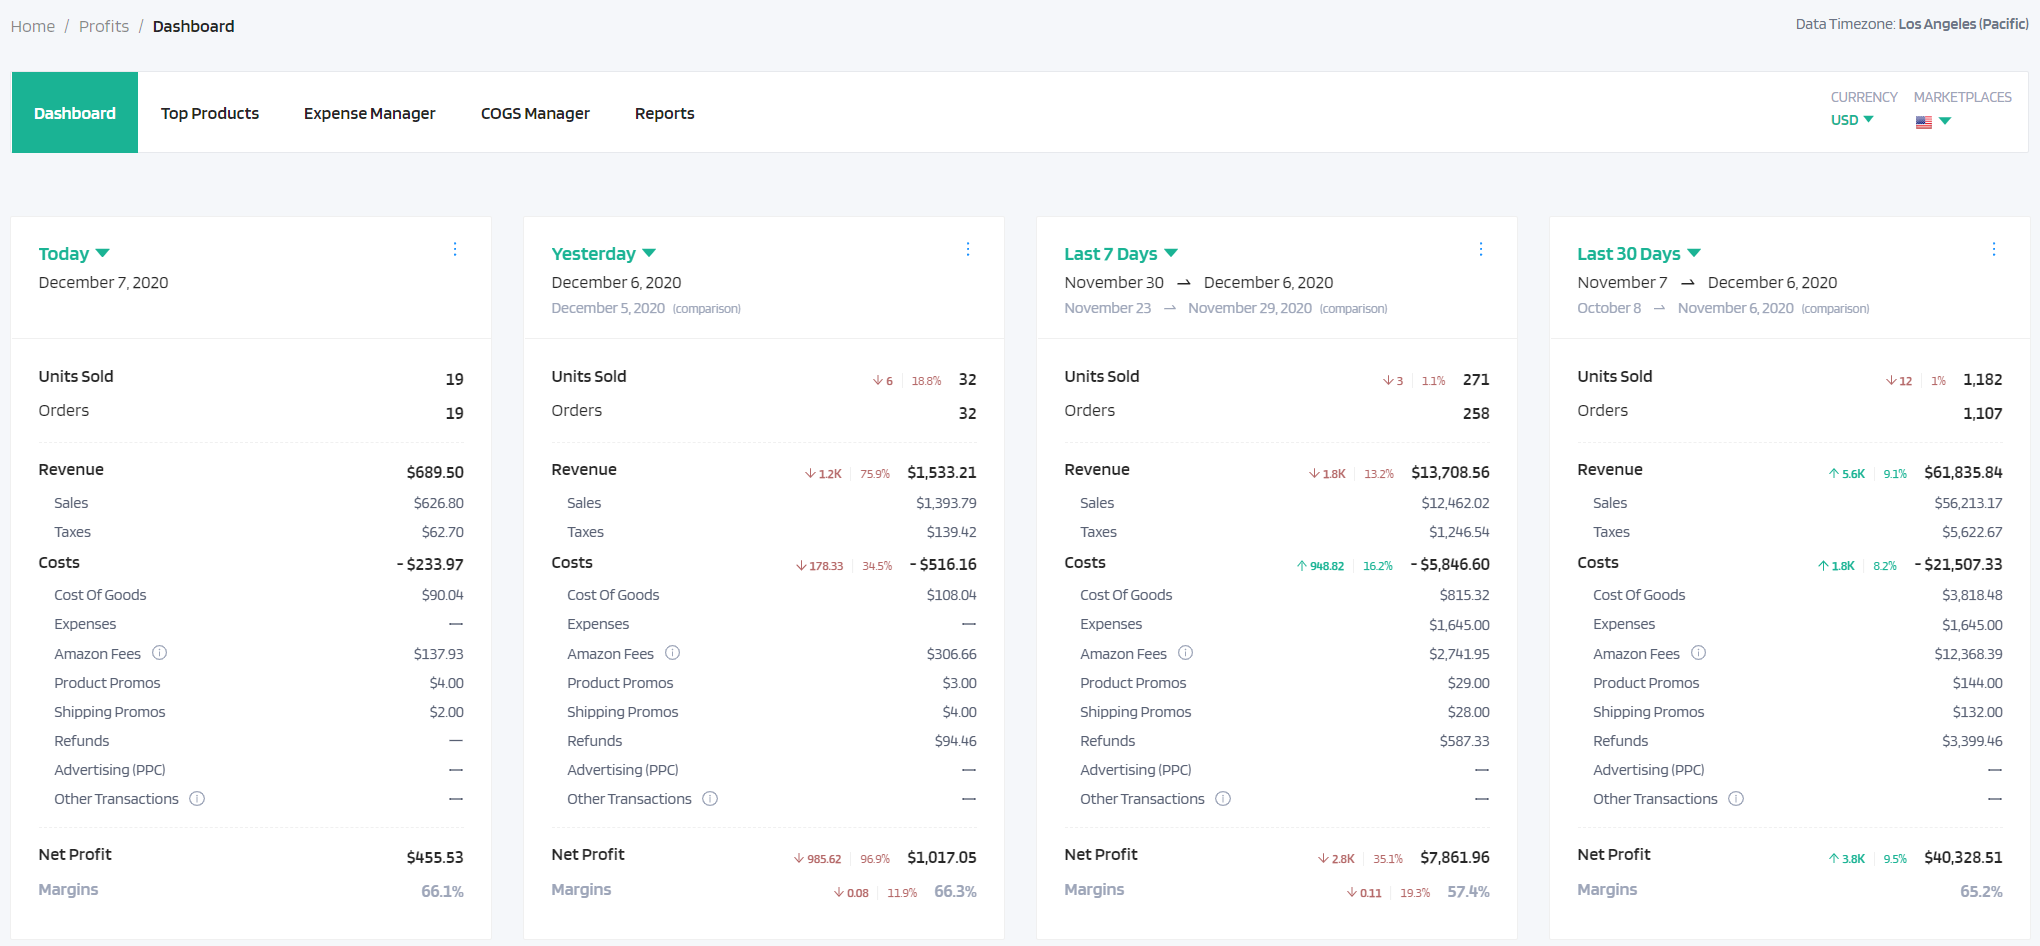
Profit Modules
The dashboard is the central hub where you will be able to quickly view your sales and profit numbers. At the top of the dashboard are four modules that can be set to time frames of your choosing; for example, you could have one set to “Today”, one to “Yesterday”, one to “Last 7 Days” and one to “Last Month”.
Each module will break down your net profit for the time frame selected. You will see the number of units sold and orders processed during that time frame as well as all of the revenue and costs that went into those sales. The “Revenue” section shows the total amount of sales and taxes collected while the “Costs” section shows all of the following:
• Cost of Goods
• Expenses
• Amazon Fees*
• Product Promos
• Shipping Promos
• Refunds
• Advertising (PPC)
• Other Transactions*
*Amazon Fees and Other Transactions are broken down in further detail when you scroll over them.
The costs are subtracted from the revenue to reveal your net profit. For modules set to time frames other than “Today”, you will also see the numbers and percentage differences in comparison to the previous time frame covered. For example, under “Last 7 Days”, you will not only see the data for your last seven days, but also how it compares to the last seven days before that. Clicking on the three dots in the top right corner of any module will give you the option to export this data in a CSV Report.
Quick Overview
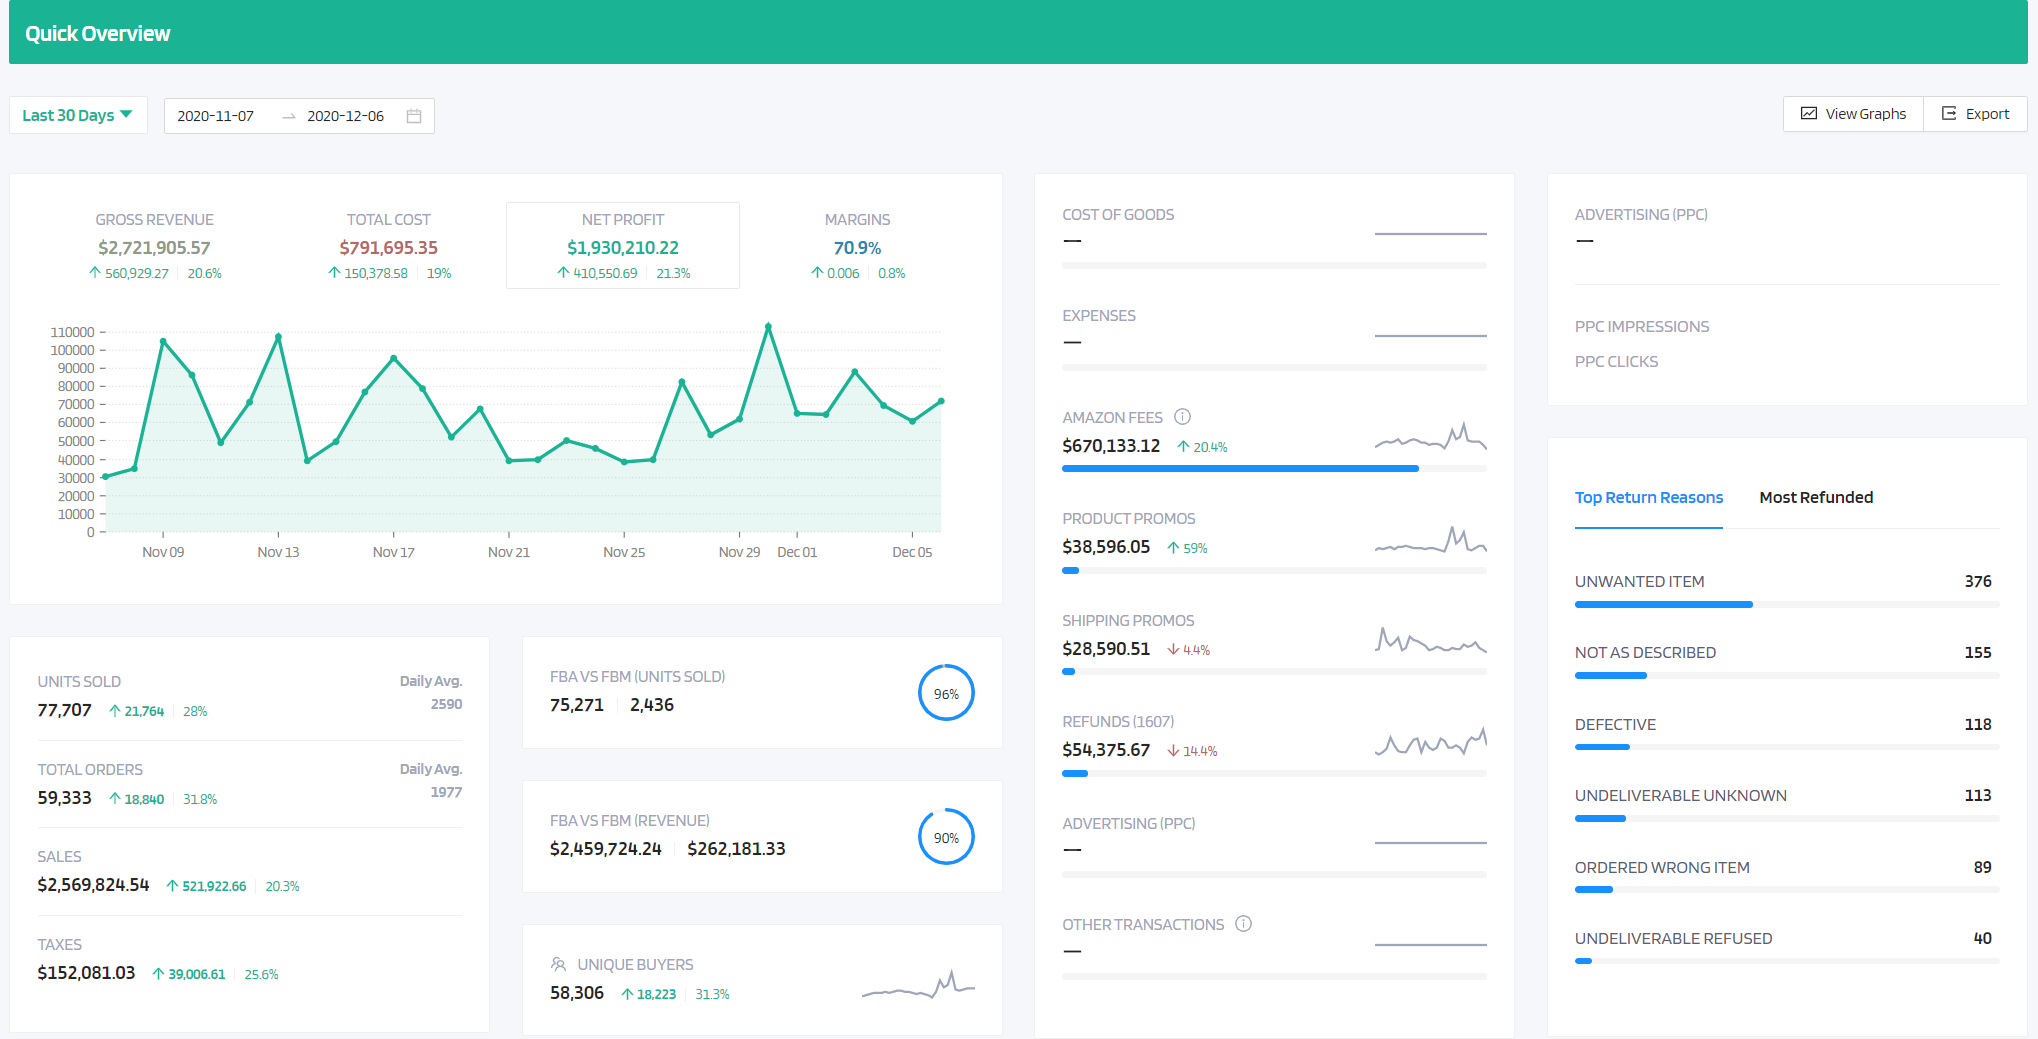
All of the data listed in the modules above is available on an attractive and intuitive graph in the “Quick Overview” section right below those modules. You can select the date range you want to see your data graphs on by using the drop-down menu or the custom date range box in the top left corner of the Quick Overview section.
Once your time frame is selected, you will be able to see all of your relevant data and quickly rotate graphs of “Gross Revenue”, “Total Cost”, “Net Profit”, and “Margins” by simply clicking on the one you want to see. The Quick Overview section also includes statistics such as:
• FBA vs. FBM sales
• In-Stock FBA Inventory
• Unique Buyers
• Most Refunded Items
• Top Return Reasons
For even more graphs, you can click on the “View Graphs” button in the top right corner of the Quick Overview section.
Profits and Loss Graphs
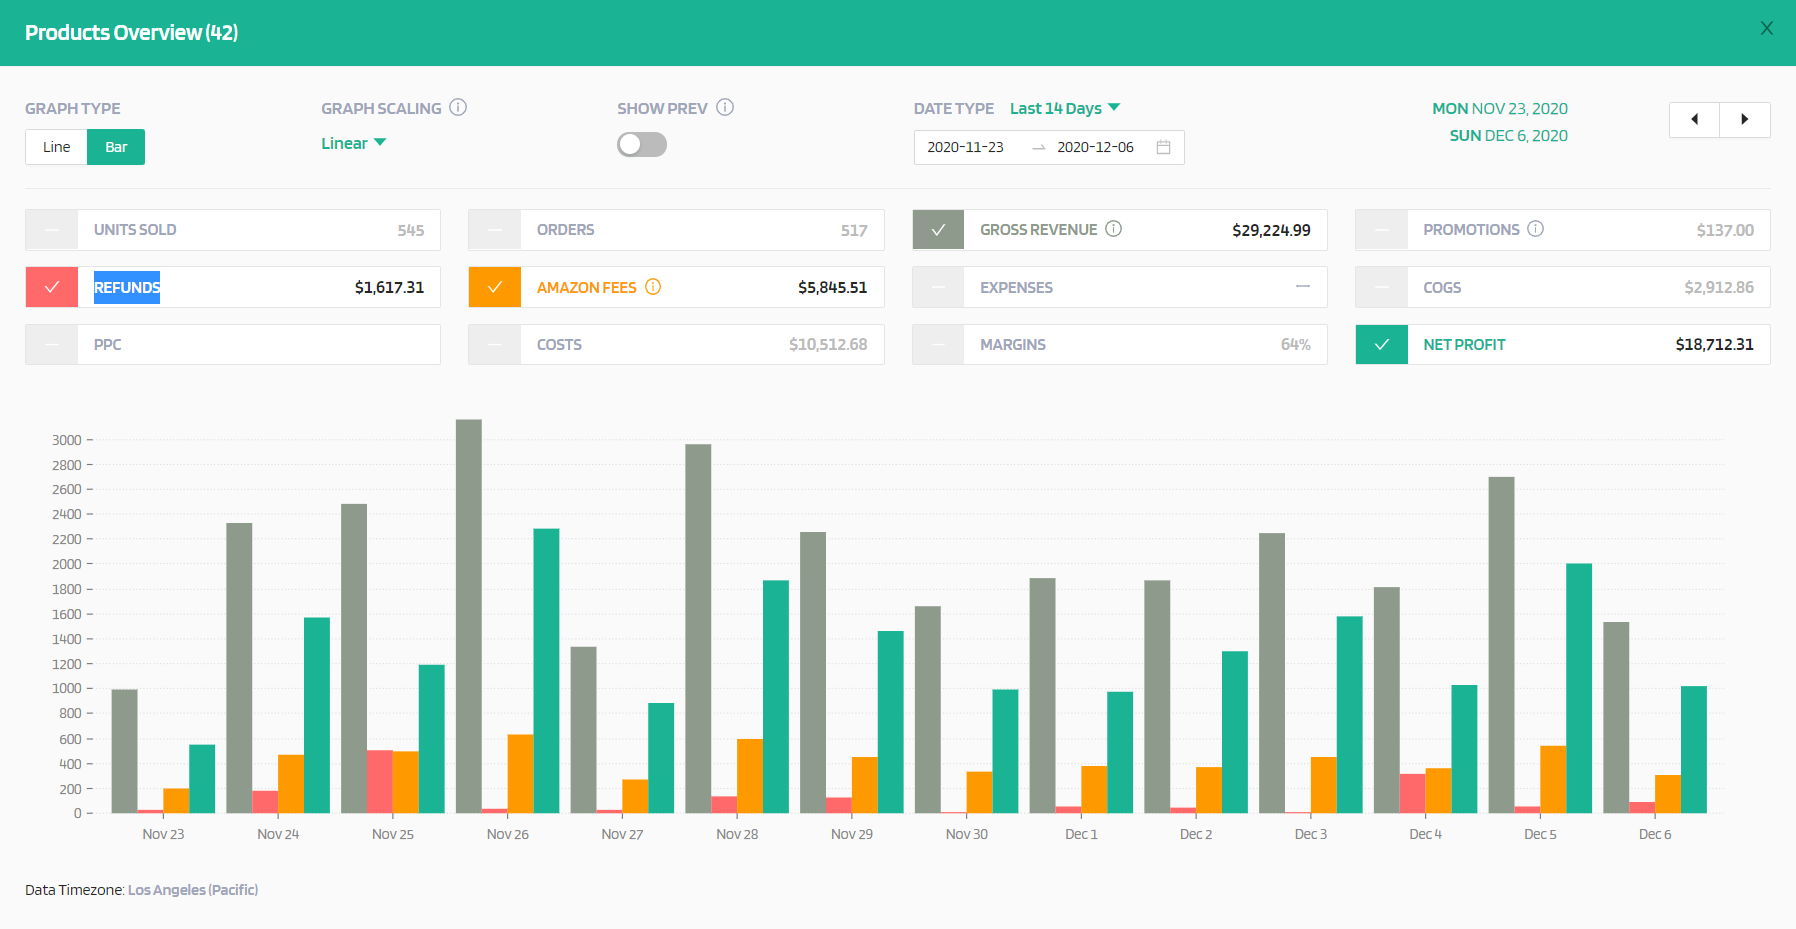
Once you have selected “View Graphs”, you will be able to customize any graph you want to your exact specifications.
• Graph Type – Choose whether you’d like to see your graph in line or bar format
• Graph Scaling – You can choose to automatically scale your graph or to have it displayed linearly or by percentage.
• Show Previous – Toggle the data from the previous period of time covered on or off.
• Date Type – Select the exact date range you’d like to see data for from a drop down menu or a custom range of your choice.
• Arrows – Use the right and left arrows to quickly move from one date period to the next, making it easy to scroll among days, weeks, or months to see important changes in data.
• Data Selection – Units Sold, Orders, Gross Revenue, Promotions, Refunds, Amazon Fees, Expenses, COGS (Cost of Goods), PPC (Pay-Per-Click Advertising), Total Costs, Margins, and Net Profit are all available to be graphed. You can select as many or as few of these data points as you’d like you show on your graph.
By Product Labels
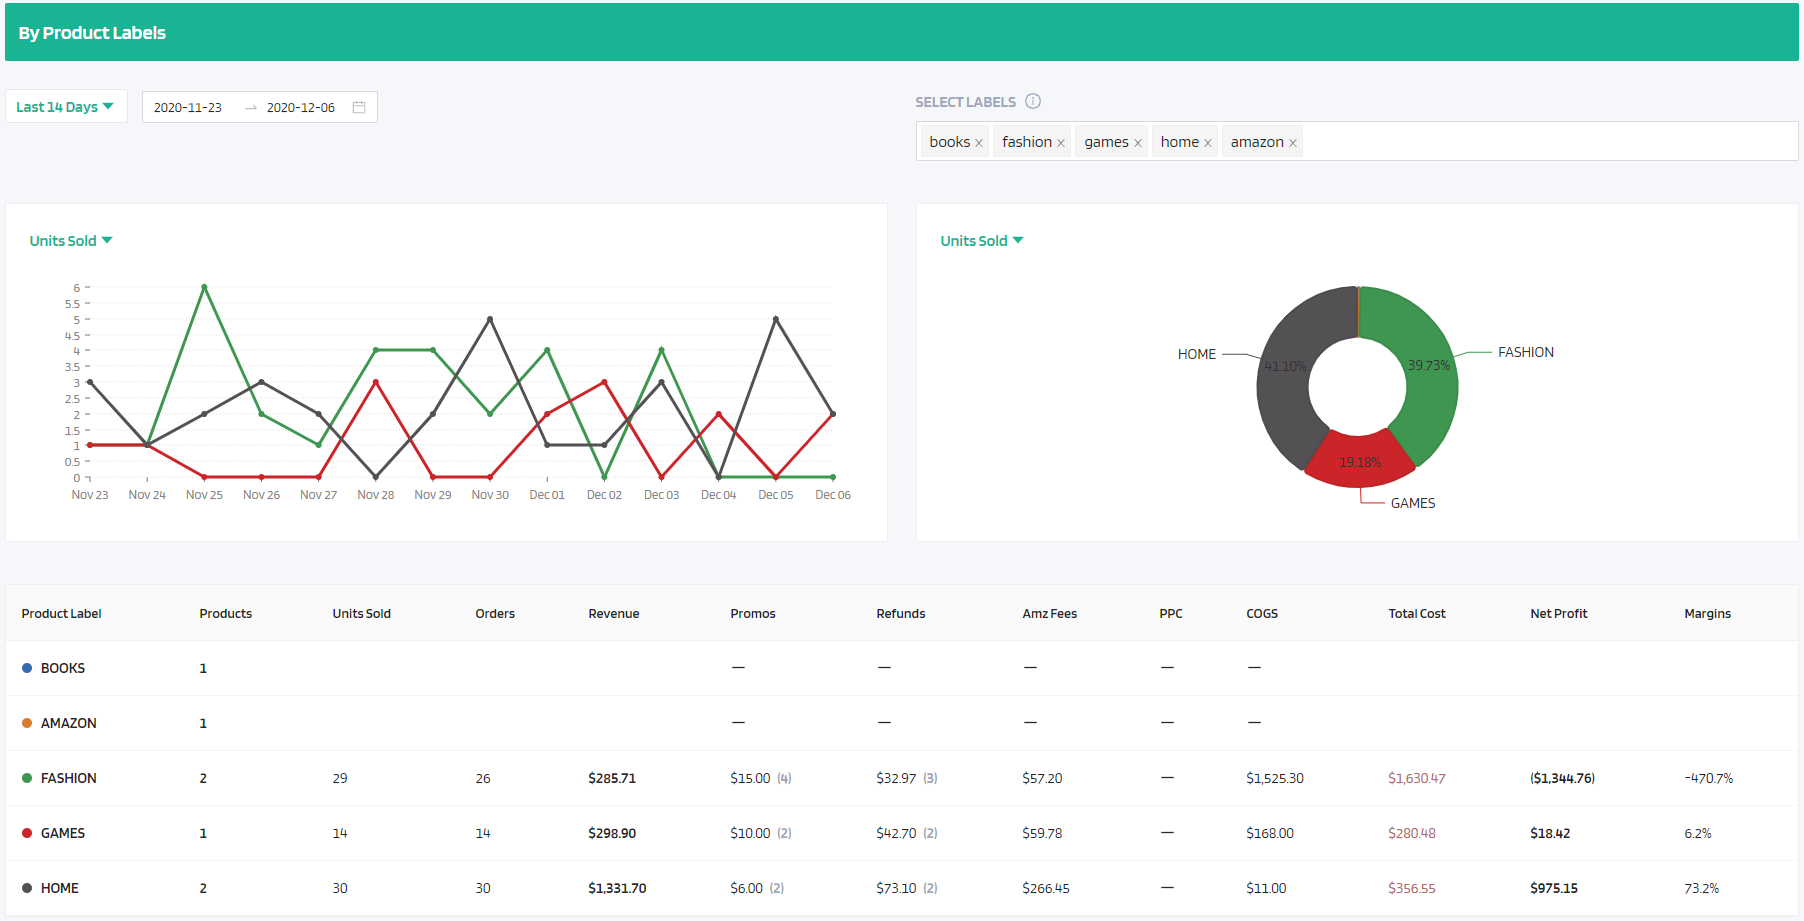
FeedbackWhiz gives users the option of adding up to five customizable product labels to each of your products. These can be categories such as “Books”, “Electronics”, or “Games”, or other labels you might be testing out such as “Original Product” or “Upgraded Model”. Product labels put you in control of how you organize your inventory.
On the “By Product Labels” section of the dashboard, you will be able to view graphs based on how specific product labels are performing. You can select the date range of your choice and have the graph show any of the following data on your selected product labels:
• Units Sold
• Number of Orders
• Gross Revenue
• Amazon Fees
• Advertising PPC
• Total Cost
• Net Profit
These graphs are displayed in both line graph and pie chart formats. While the previous graphs on the dashboard give a more big-picture view of your business, this section allows you to hone in on specific categories to see how they are performing and trending.
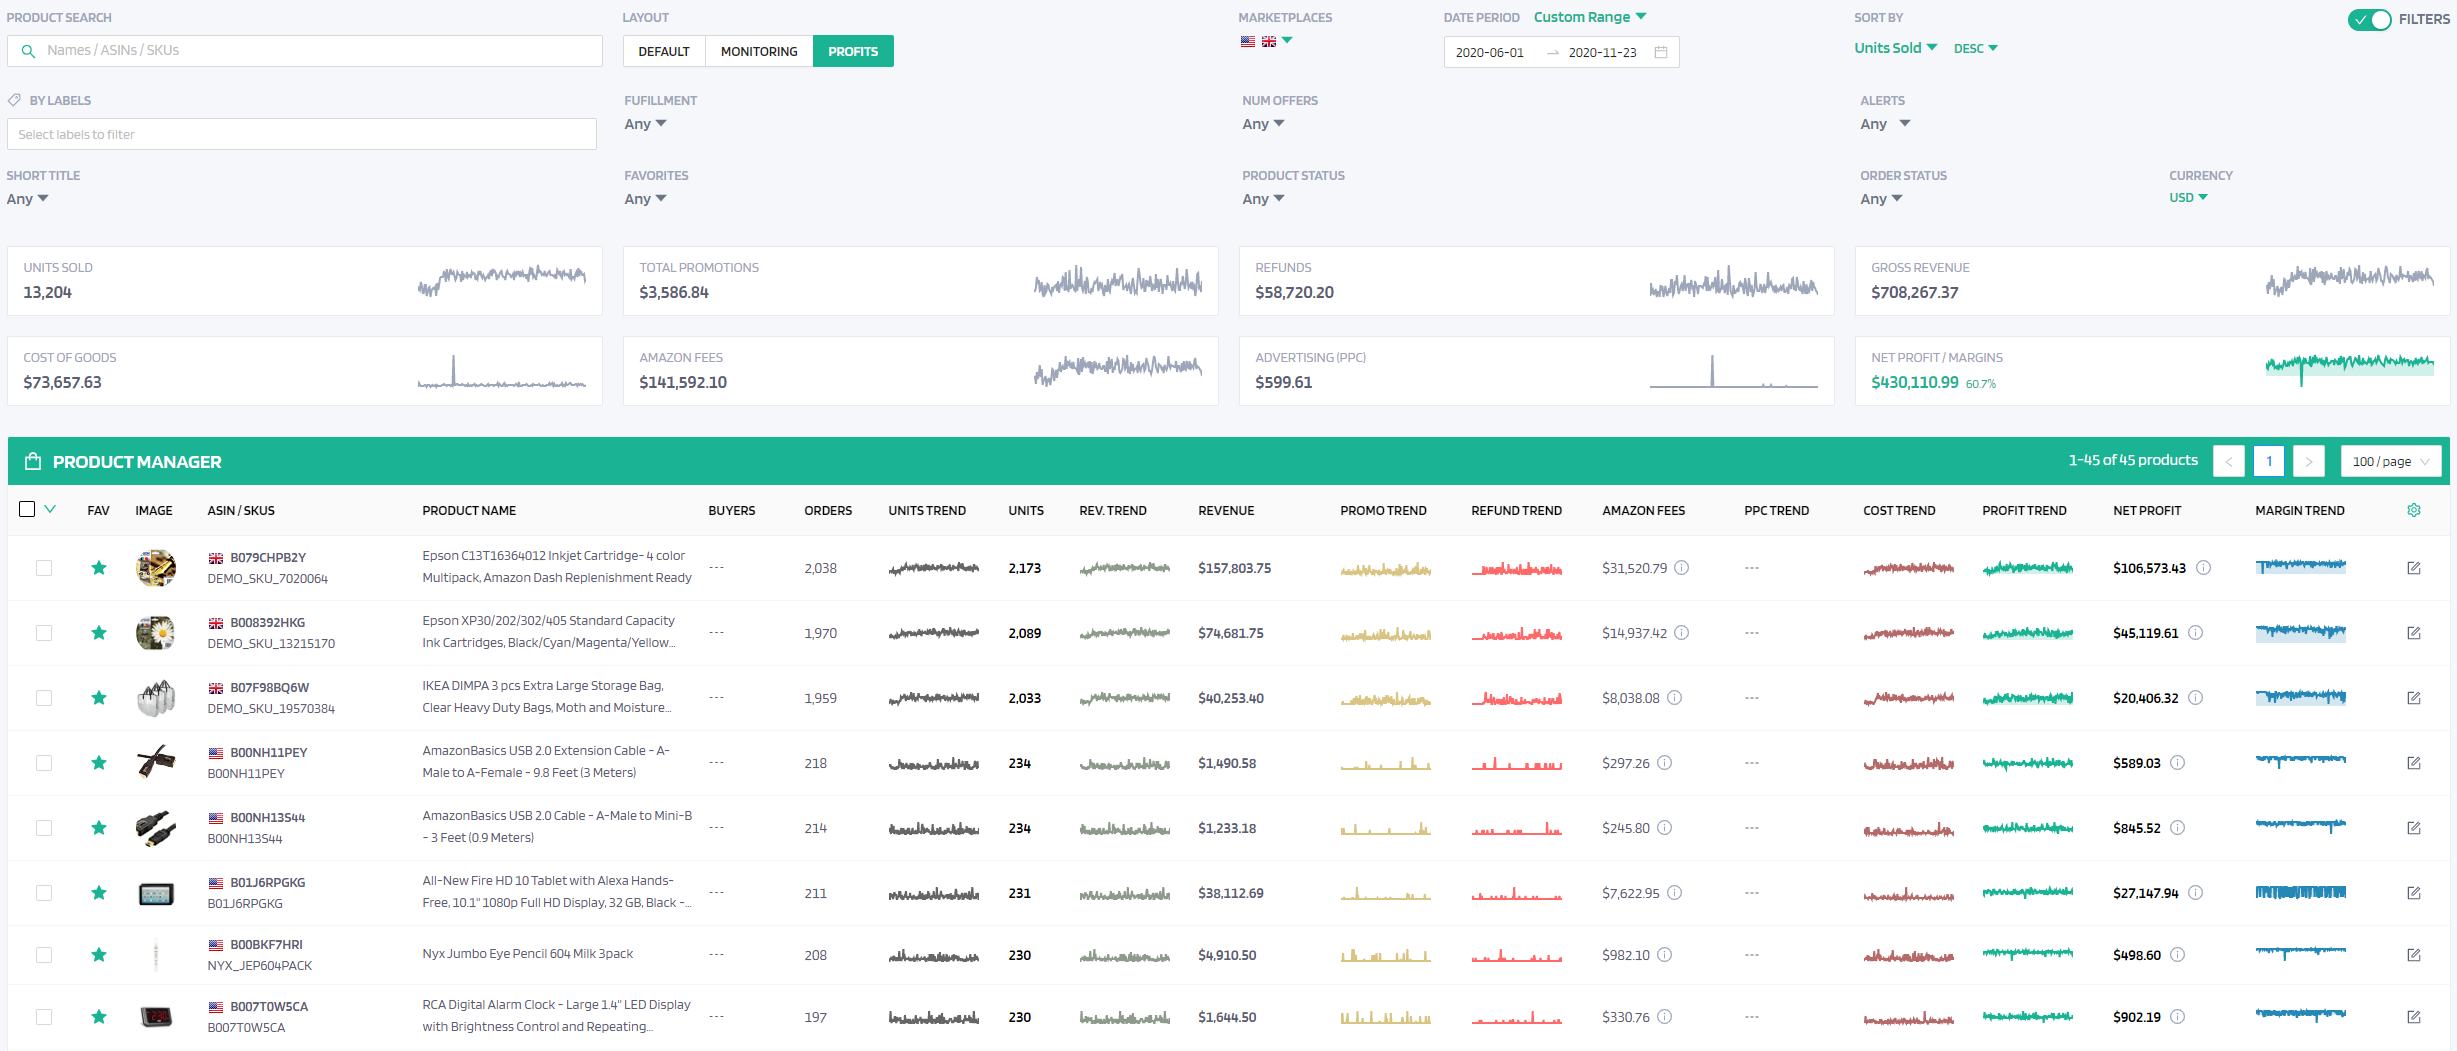
Top Products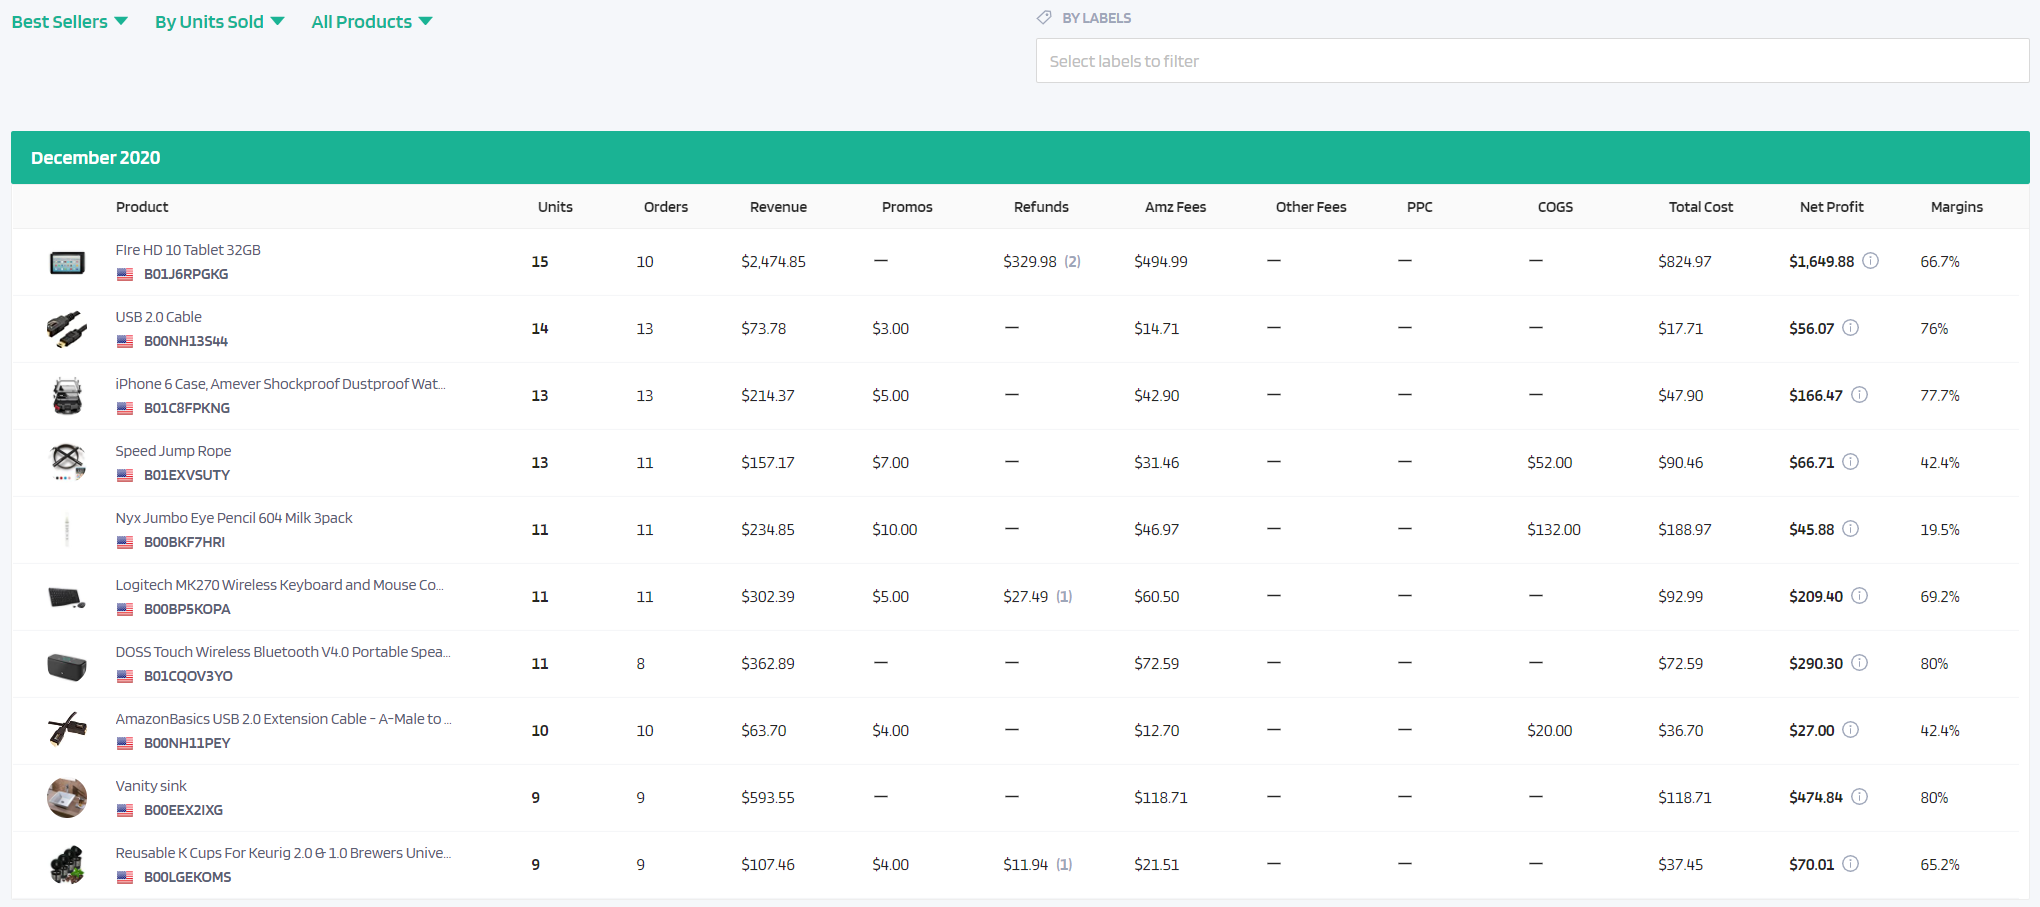
Continuing with the trend of honing in on specifics, the top products section allows you to do exactly that by breaking down your profits and margins on an item-by-item basis. This section lists each ASIN’s performance by month, with the current month at the top and previous months visible by scrolling down. The following data is displayed for each product in your Amazon store:
• Unit Price
• Units Sold
• Orders
• Revenue
• Promos
• Refunds
• Amazon Fees
• Other Fees
• PPC
• COGS
• Total Cost
• Net Profit
• Margins
To order the data displayed for any given month, users of FeedbackWhiz’s Profits and Accounting Tool have three drop-down menus to choose from:
• Best Sellers or Worst Sellers – You can have your products shown in order of best to worst performers or worst to best.
• By Gross Revenue or Units Sold
• All Products or Only Favorites – If you just want to hone in on specific products you have added as “favorites”, you can do so using the “Only Favorites” option.
You can also use the “By Labels” box to only see products that have your selected labels.
Expense Manager
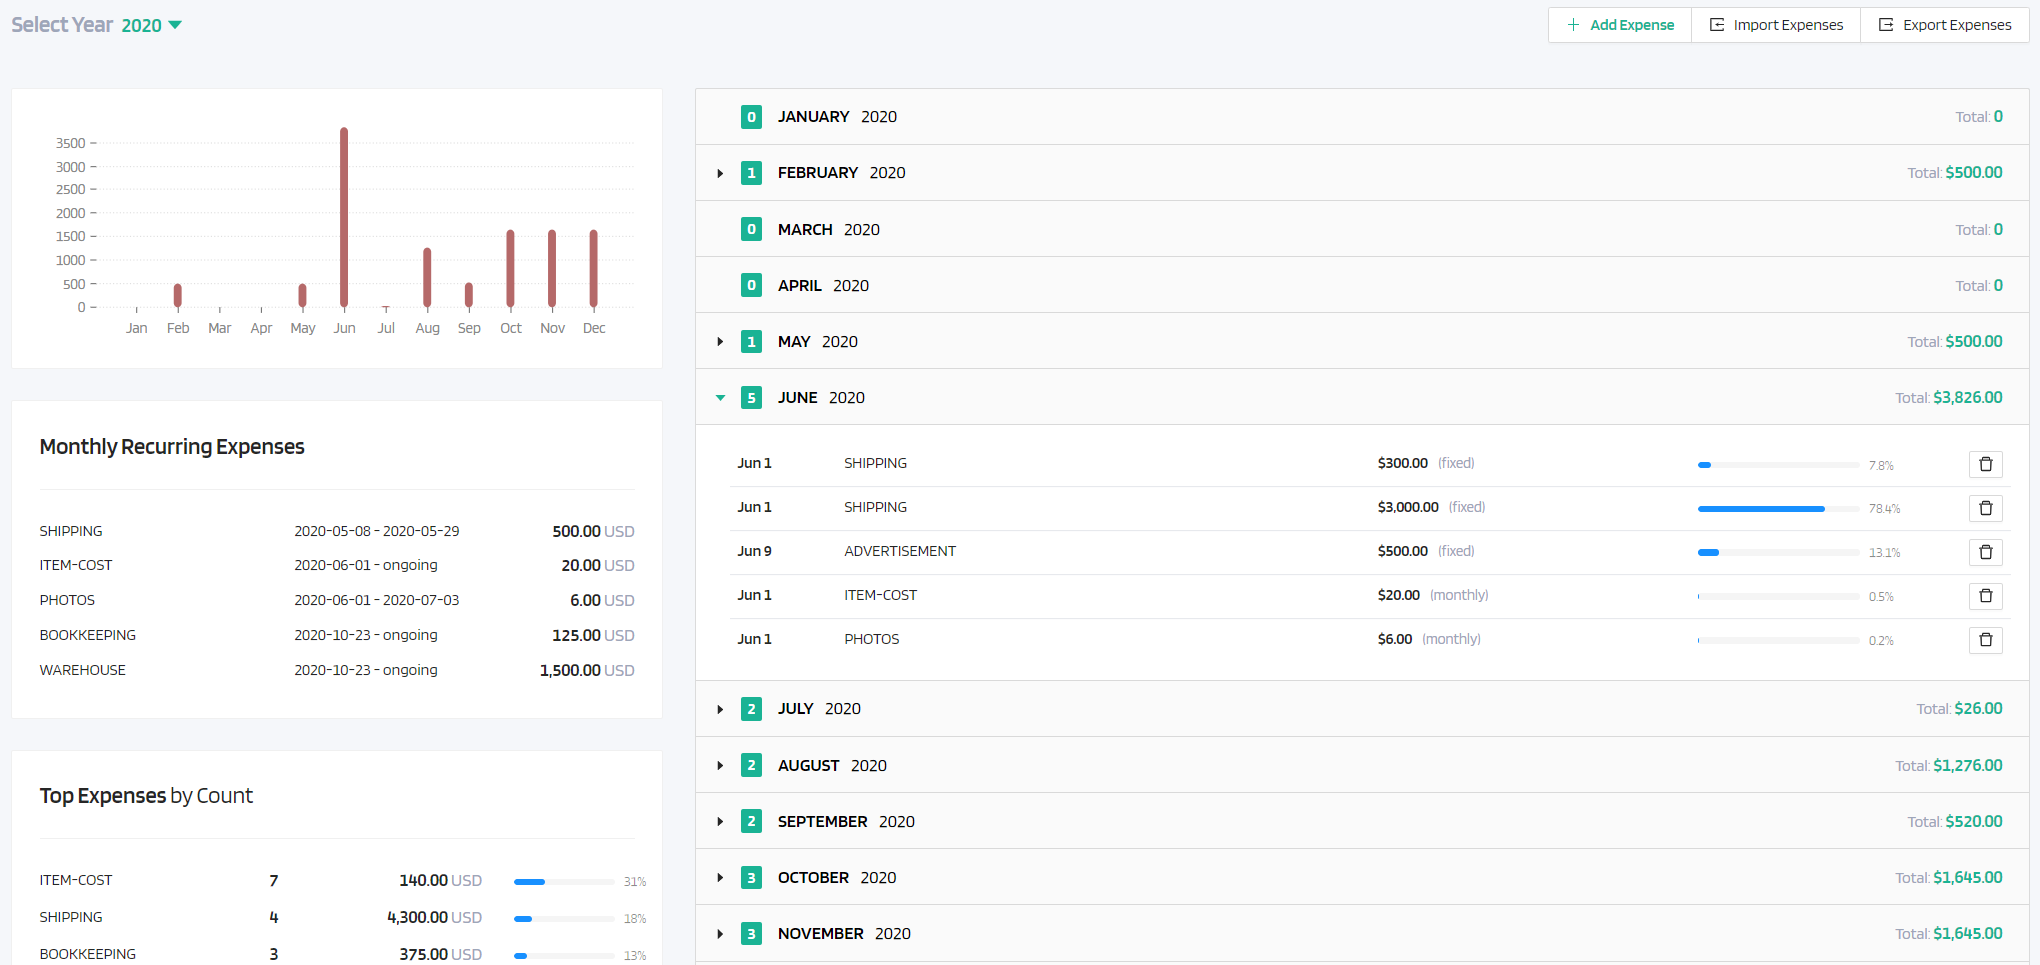
The “Expense Manager” section allows you to keep track of all of the expenses that go into running your business in one convenient location. Business expenses are shown on a graph on the left side of this page and by month on the right. Below your expenses graph you can also view your monthly recurring expenses, your Top Expenses by Count, and your Top Expenses by Total.
Buttons in the top right corner of this page allow you to add expenses or to export a CSV report of your expenses. Clicking on the “Add Expense” button allows you to add the expenses that will be tracked here. You can add fixed one-time expenses or monthly recurring expenses along with the date, amount, and ASINs if applicable.
Cost of Goods Manager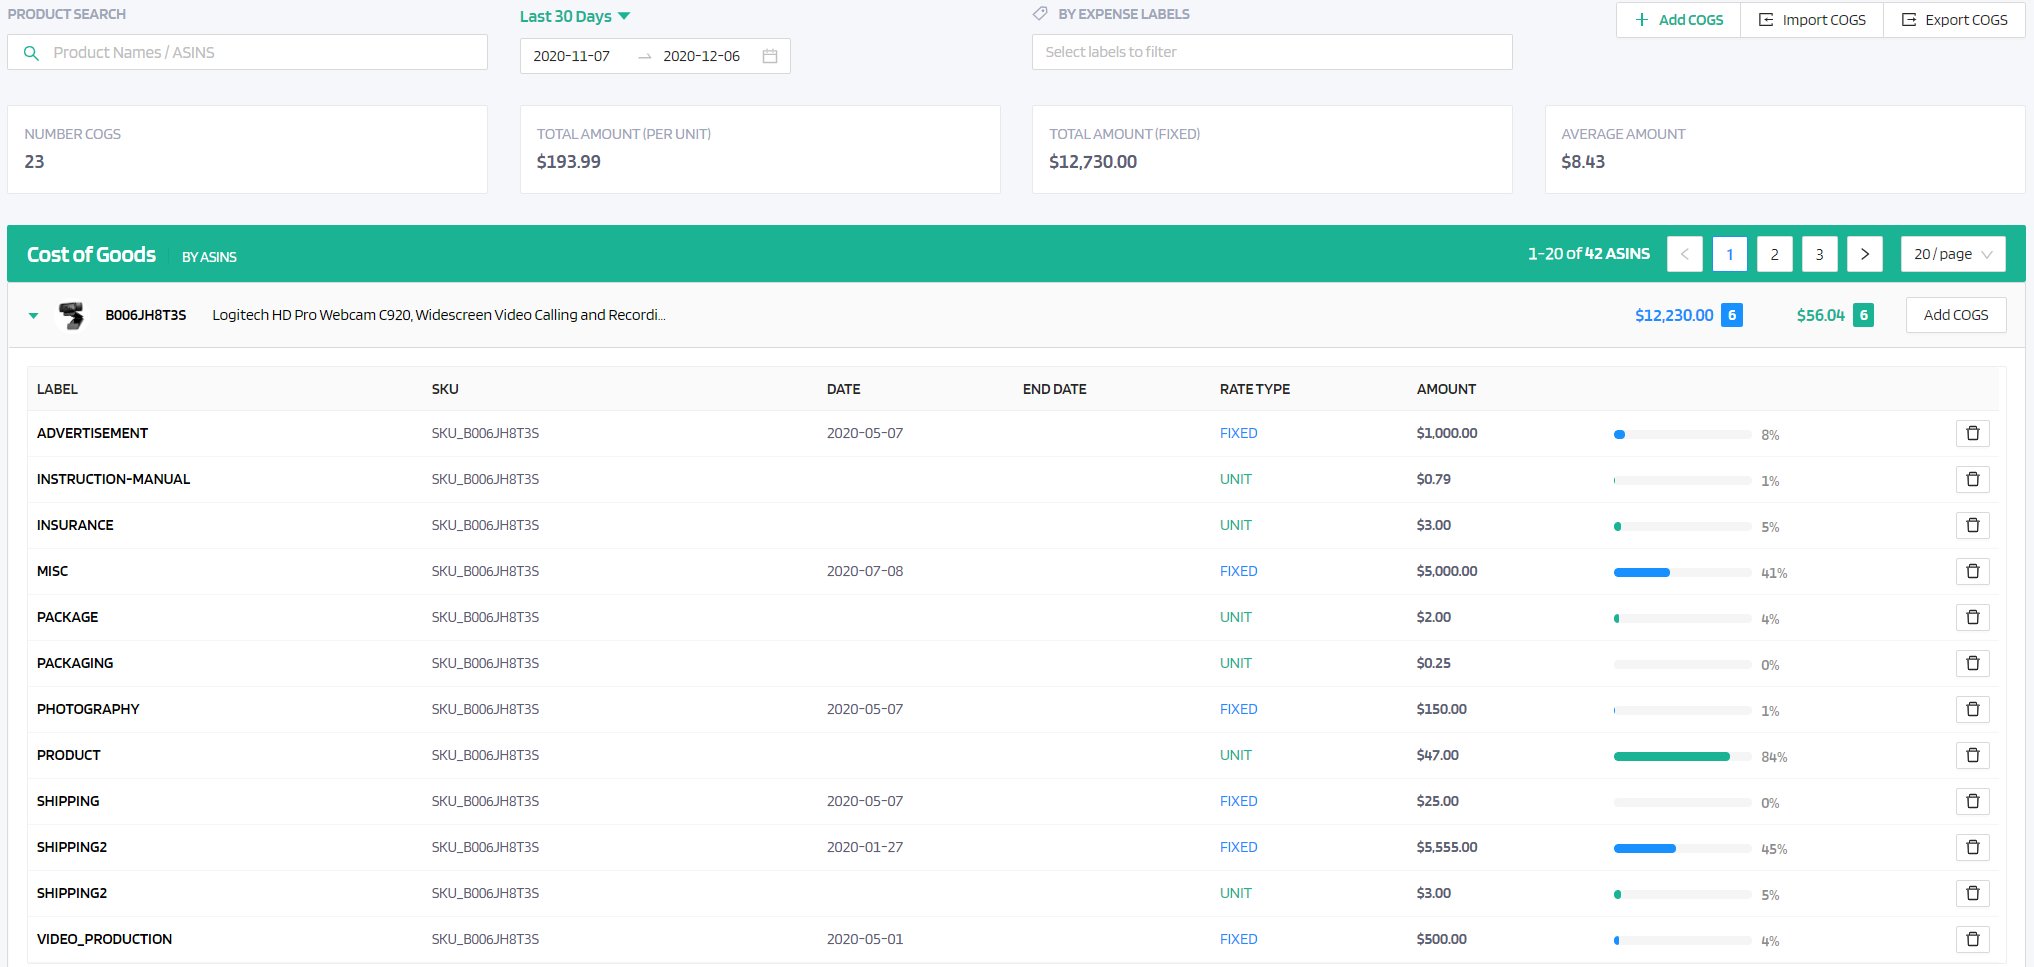
While the Expense Manager section covers the day-to-day expenses of running your business, the “COGS Manager” covers the cost of your products. Each product is listed by ASIN and shows the ASIN, product name, number of units, and total cost of goods. You can select a date range via a drop down or set your own custom date range to see the cost of goods in your Amazon store over that time.
The product search bar on this page can be used to look up individual products by their name or ASIN. You can also look up costs by specific expense labels. Buttons in the top right corner allow you to add COGS or to export a CSV report on them. When you select “Add COGS”, you will be able to add your cost of goods by entering the ASIN, the expense label (COGS Name), and the amount. You also have the option of adding a start date or end date if you know that a COG will be changing on a specific date.
Reports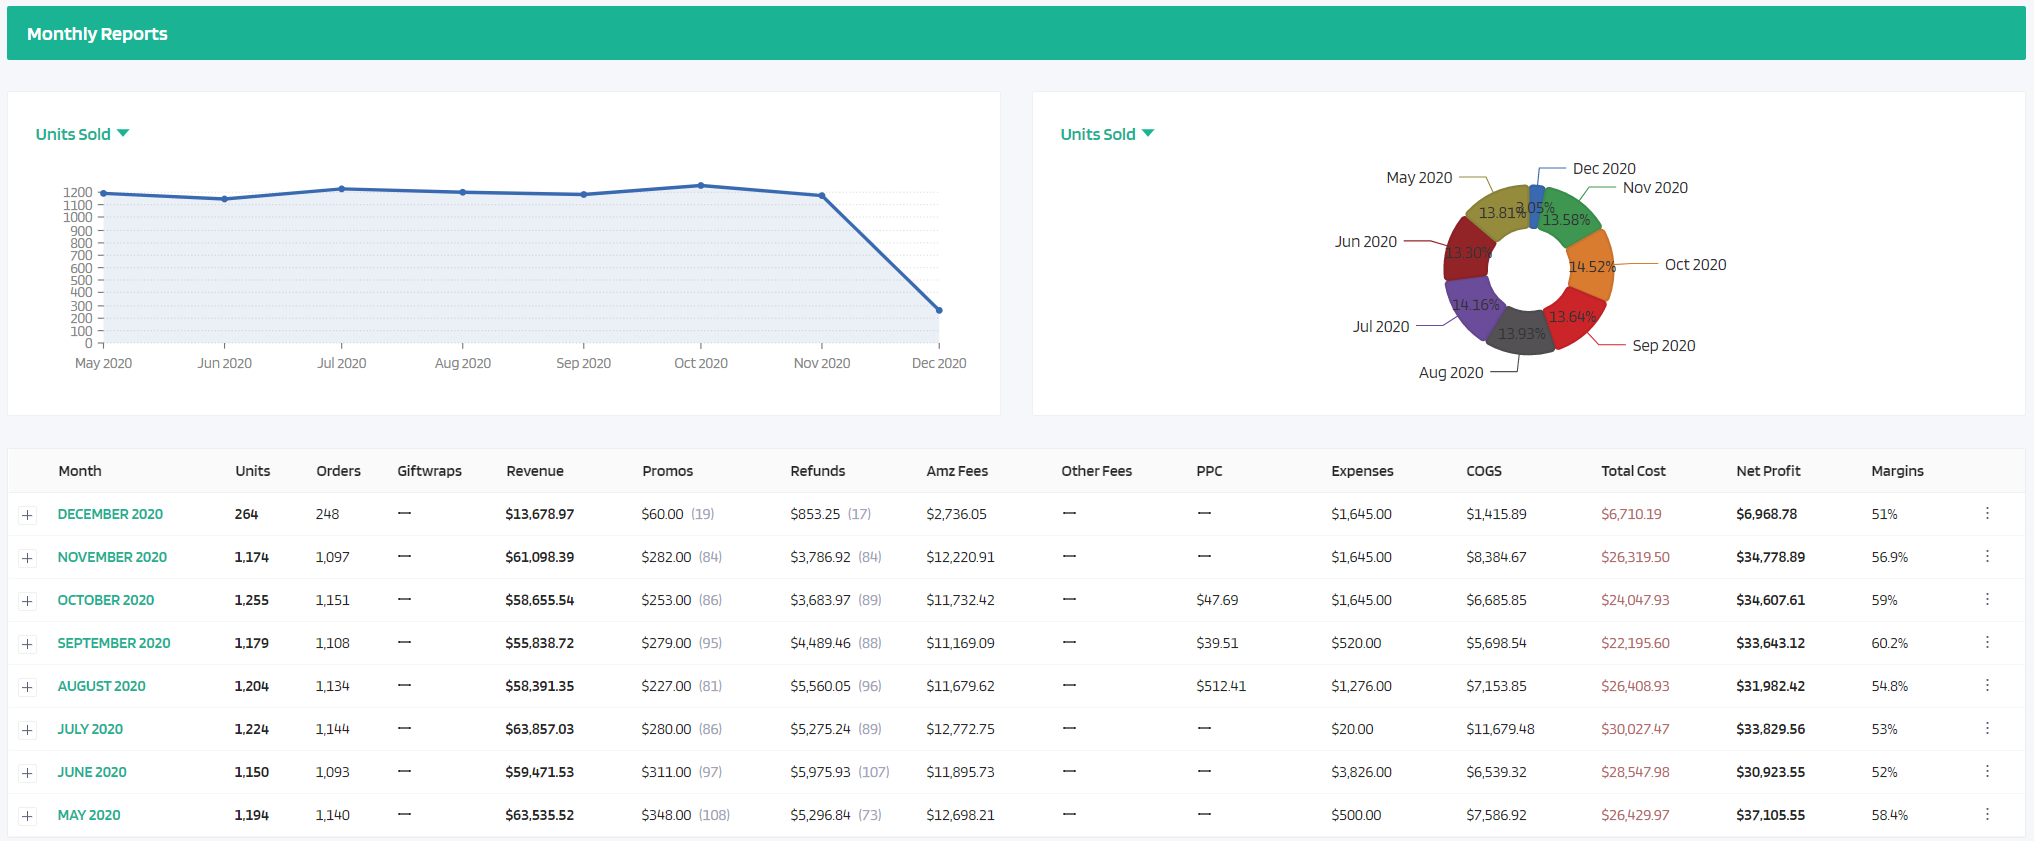
The “Reports” section shows the same data you have seen and entered in the other sections with an emphasis on the big picture. Under “Weekly Reports”, you can easily see all of the following data for each of the last eight weeks, with the current week at the top:
• Week Dates
• Units Sold
• Orders
• Giftwraps
• Revenue
• Promos
• Refunds
• Amazon Fees
• Other Fees
• PPC
• Expenses
• COGS
• Total Cost
• Net Profit
• Margins
When you scroll down to the “Monthly Reports” section, you can see all of this same data for each of the last eight months. Each month can be clicked on to reveal a day-by-day report for every day of the month. All of these monthly reports can be exported or viewed in graph form as well.
The FeedbackWhiz Profits and Accounting Tool leaves no stone in your business unturned. Every expense and sale is accounted for, giving you a complete picture that you can use to determine what areas are working and which ones might need improvement. Having this much data at your fingertips that is so easy to customize and to read with attractive graphs and charts is indispensable. Give FeedbackWhiz’s Profits and Accounting Tool a try today.
Get started with a 30-day free trial of FeedbackWhiz and take your Amazon business to the next level.
0 Comments