
The COVID-19 pandemic took a toll on everyone in 2020. Layoffs and government shutdowns had major impact on the economic well-being of millions of people around the world. And even those that were not negatively impacted financially had to deal with the mental and physical ramifications of quarantine and the pandemic. Just about everyone was happy to see the calendar switch over to 2021, hopefully bringing about a fresh start for all of us. Luckily, there are a plethora of Amazon stats for sellers to look forward to this year.
For Amazon sellers, there is plenty of reason for optimism looking ahead to 2021 and beyond. The statistics show that Amazon is thriving now more than ever. Let’s take a look at seven awesome Amazon stats for sellers in 2021 to enjoy.
Why are these Amazon stats important for sellers?
Whether you are a seasoned Amazon seller veteran or someone considering starting their own business in 2021, these statistics should be interesting. They will hopefully give you some insight into how well Amazon is doing and how customers think, which in turn should provide more confidence in selling on the platform.
1. Over half of Amazon sales are through third-party sellers.
In the third quarter of 2020, 54% of all of the units sold on Amazon were sold by third-party sellers (Statista, 2021). This isn’t just an anomaly, either. Amazon’s sales have been comprised of at least 50% of third-party sellers in every quarter since 2017.
Amazon is still a first-party powerhouse as it continues to build relationships around the world with suppliers and to manufacture its own goods through in-house brands like AmazonBasics. But make no mistake about it; third-party sellers are a massive part of Amazon’s business model. Both the stats and Amazon’s actions (including hiring thousands of new workers in fulfillment centers in 2020) show no signs of the slowing down any time soon. The relationship between third-party sellers and Amazon is a mutually beneficial one.
2. Amazon’s net revenue and income skyrocketed by billions in 2020.
Probably the least shocking of Amazon stats is the amount of money it raked in last year. Amazon earned a net revenue of $87.44 billion (Statista 2021) and a net income of $3.27 billion (Statista 2021) in the fourth quarter of 2019. 2020’s numbers managed to shatter those; Amazon had a net revenue of $88.91 billion and a net income of $5.24 billion in the second quarter of 2020 and hit new all-time highs with a net revenue of $96.15 billion and a net income of $6.33 billion in the third quarter. It’s safe to assume that the fourth quarter numbers will be even larger when they are released.
Due to COVID-19 guidelines, it makes sense that many turned to Amazon for their shopping needs. But these numbers are still staggering given consumers’ economic struggles. Even as things eventually return to normal, customer shopping habits may have been changed forever by this pandemic in a way that will favor e-commerce moving forward.
3. Amazon accounts for nearly 50% of all e-commerce sales in America.
In 2018, a study done by eMarketer.com revealed that Amazon owned a staggering 49.1% of the retail e-commerce sales share in the United States. No one else was even close with eBay in second place at 6.6%, Apple at 3.9%, and Walmart at 3.7%. These numbers likely fluctuate a bit from year-to-year, but Amazon undoubtedly owns the lion’s share of online sales and should continue to do so for the foreseeable future.
4. 65.7% of USA shoppers are Prime members.
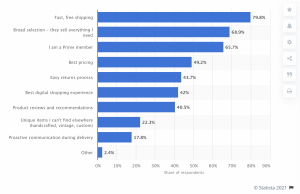
A study conducted by Statista in January 2020 asked 2000 Amazon shoppers in the United States over the age of 18 what the top reasons they chose to shop on Amazon were. The results were quite interesting:
-
Fast, free shipping (79.8%)
-
Broad selection – they sell everything I need (68.9%)
-
I am a Prime member (65.7%)
-
Best pricing (49.2%)
-
Easy returns process (43.7%)
It turns out the convenience of fast free shipping was a significantly bigger draw than even low prices. That should be incentive enough to take advantage of Prime.
65.7% of all users are Prime Users
5. 40.5% of online shoppers use Amazon for its product reviews.
That same study revealed that 40.5% of online shoppers use Amazon for its product reviews and recommendations. Another study conducted by Statista revealed that only 6.2% of respondents claimed they don’t trust Amazon reviews. Another 13.6% of customers fully trust them, 55.6% somewhat trust them, and 24.6% of them trust reviews only from verified purchasers.
There is no denying the importance of the quality and quantity of the product reviews on your products. FeedbackWhiz can help you maximize the number of sales that you are able to convert into product review, which in turn will build more brand trust and generate more sales.
Amazon recently removed the comments feature on product reviews. Here’s what you need to know.
6. Electronics (44%) rank highest among most frequently purchased categories.
Not sure of what category to sell in or considering branching into a new category? Feedvisor’s Consumer Survey in 2019 broke down what products consumers bought on Amazon most frequently.
-
Electronics (44%)
-
Clothing, Shoes & Jewelry (43%)
-
Home & Kitchen (39%)
-
Beauty & Personal Care (36%)
-
Books (33%)
-
Cell Phones & Accessories (28%)
-
Movies & TV (25%)
-
Pet Supplies (20%)
-
Sports & Outdoors (17%)
-
Grocery & Gourmet Food (15%)
-
Automotive Parts & Accessories (13%)
-
Other (9%)
-
Baby (9%)
7. Amazon’s global reach is now more than 100 countries.
Amazon boasts over 150 million paid Prime members and over 300 million active customer accounts worldwide (Amazon Global Selling). Amazon currently has 16 different marketplaces that ship products to more than 100 countries around the globe.
FeedbackWhiz would love to help you expand your business’s reach as well. Sign up for our free newsletter to get more helpful Amazon stats, seller tips, news, and information on our latest products.
0 Comments